Sky and weather
El Niño, La Niña and neutral: what defines each phase, how long it lasts and who declares it
Niño, Niña and neither one are the three faces of the same phenomenon. Here is what actually decides which one is happening, how long it can last, and who has the final say.
Three phases, one phenomenon
El Niño and La Niña are not independent events — they are the two opposite phases of the same climate pattern called ENSO (El Niño–Southern Oscillation). El Niño is the warm phase, La Niña the cold phase, and between the two sits a third possibility rarely talked about: the neutral phase, when the equatorial Pacific isn’t warm enough or cold enough to qualify as either.
In our article on the "super El Niño" we explained what that nickname means; here we focus on something different: what exactly separates one phase from another, how long an episode can run, and who officially decides when it starts and ends.
The rule that separates Niño, Niña and neutral
NOAA uses an indicator called the Oceanic Niño Index (ONI): the three-month running average of sea surface temperature anomaly in a strip of the central and eastern Pacific known as the Niño 3.4 region. An "anomaly" is the difference from a historical average, not the actual temperature of the water.
When that average reaches +0.5°C or higher for at least five consecutive, overlapping three-month periods, El Niño is declared. When it drops to -0.5°C or lower under the same conditions, it’s La Niña. If it stays between those two values, the Pacific is in neutral conditions — not warm enough or cold enough to tip the balance.
The mechanism: winds and water pushing on each other
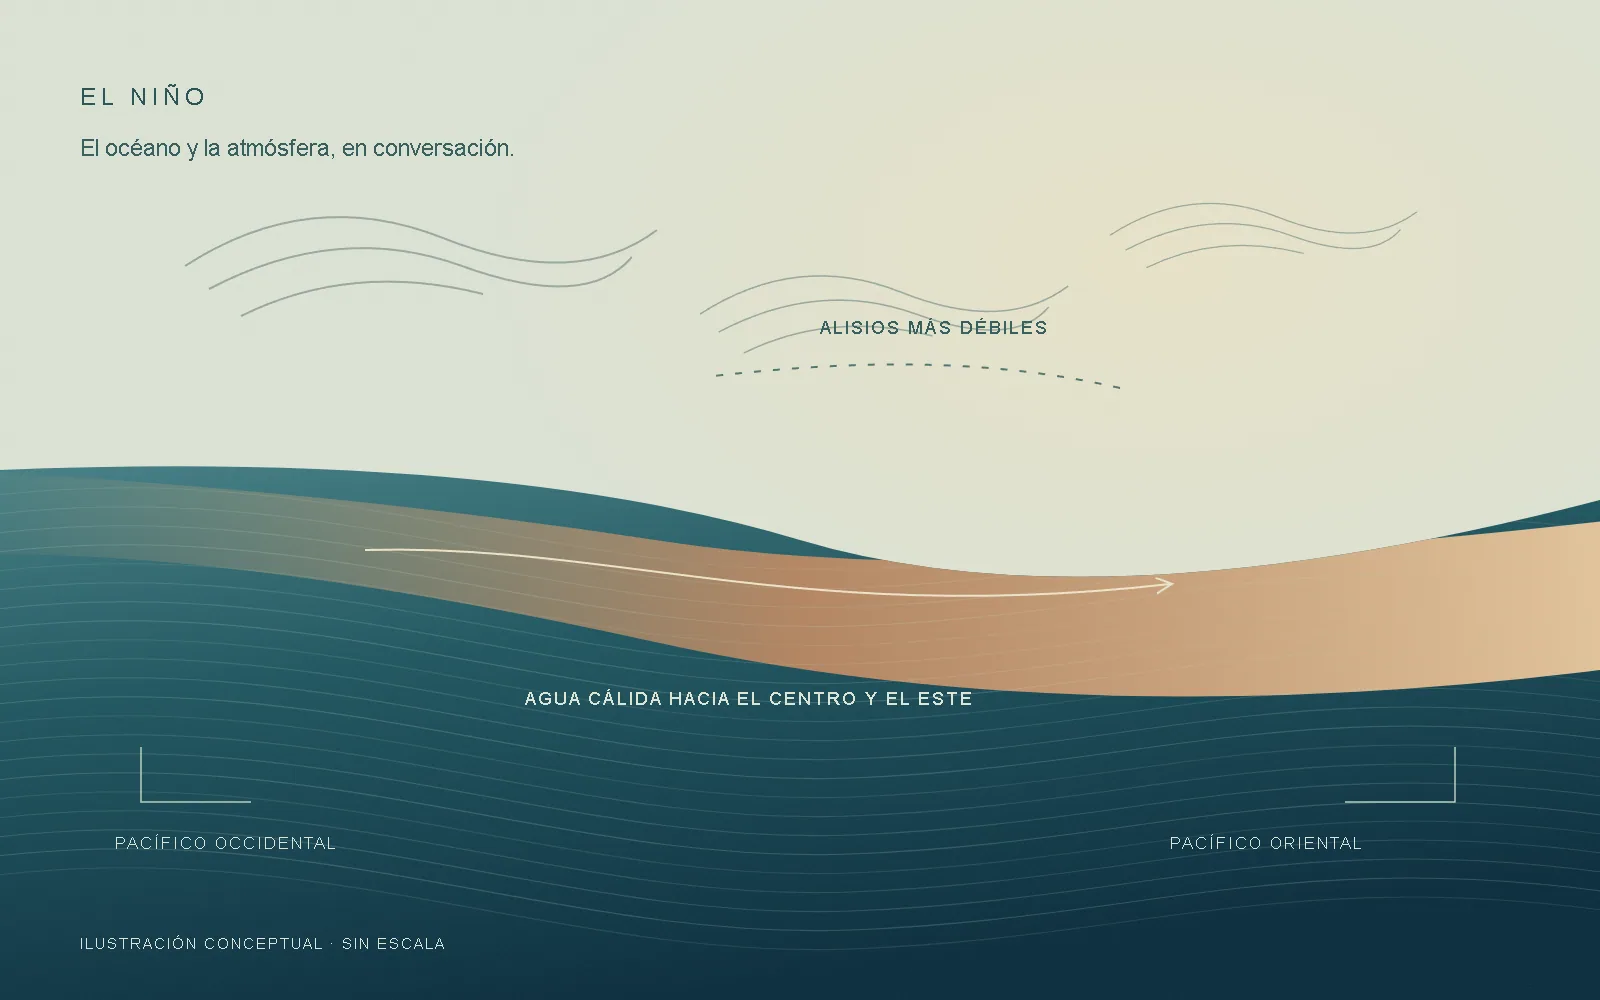
What decides which way the system tips is a feedback relationship between ocean and atmosphere, described by meteorologist Jacob Bjerknes building on Gilbert Walker’s work. Under normal conditions, trade winds blow east to west along the equator, pushing warm surface water toward the western Pacific and allowing cold, deep water to rise to the surface in the eastern Pacific.
During La Niña, those winds intensify: even more warm water piles up in the west and more cold water rises in the east, reinforcing the pattern itself. During El Niño, the opposite happens: trade winds weaken, warm water spreads toward the central and eastern Pacific, and that shift weakens the winds even further. It’s a self-feeding cycle, until slower processes inside the ocean eventually shut it down.
How long an episode can last
According to NOAA, a typical ENSO cycle lasts 9 to 12 months and recurs irregularly every two to seven years. The World Meteorological Organization (WMO) gives a wider range for the extremes: El Niño can run as long as 18 months, and La Niña as long as three years.
That extreme isn’t just theoretical: between late 2020 and early 2023, the Pacific went through a "triple-dip" La Niña — three consecutive years in the cold phase — one of the longest episodes of its kind on record. NOAA-funded research suggests these multi-year events are more likely when they follow a particularly strong El Niño, though predicting their exact duration remains a challenge.
Who monitors and officially declares it
There’s no committee that "declares" El Niño the moment it crosses the threshold: NOAA’s Climate Prediction Center continuously monitors the ONI and other indicators, and publishes periodic diagnostics on the state of ENSO and the odds that a phase will continue or shift. The World Meteorological Organization coordinates global updates with meteorological agencies from different countries.
In February 2026, the Climate Prediction Center itself announced an adjustment to its methodology — the RONI index, which we explain in our article on the super El Niño — precisely so that the +0.5°C / -0.5°C threshold stays a fair reference as the planet’s average temperature keeps changing.
For anyone traveling to Baja California Sur, this phase isn’t just a meteorological data point: as we explain in our article on El Niño and marine life, it can influence how active the food chain is that supports, from plankton to whales, much of what you’ll see on an expedition.
References to keep exploring
- NOAA, National Ocean Service · What are El Niño and La Niña?
- NOAA, Climate.gov · Climate Variability: Oceanic Niño Index
- NOAA, Climate.gov · The Rise of El Niño and La Niña (ENSO blog)
- NOAA, Global Ocean Monitoring and Observing · Recent "Triple-Dip" La Niña Upends Current Understanding of ENSO
- World Meteorological Organization · El Niño / La Niña Phenomena
Sources accessed on 8 November 2026. Editorial text by Con Gorra Expeditions.